User Behavior Analytics takes center stage, inviting you into a world where data shapes decisions and actions. From understanding user interactions to optimizing experiences, this dynamic field offers a wealth of opportunities for businesses seeking growth and success.
In the realm of digital landscapes, User Behavior Analytics plays a key role in deciphering the intricate patterns of user actions, paving the way for informed strategies and impactful outcomes.
Understanding User Behavior Analytics
User Behavior Analytics (UBA) is the process of tracking, collecting, and analyzing data on how users interact with a website, application, or system. By studying patterns and behaviors, businesses can gain valuable insights to improve user experience, enhance security, and optimize marketing strategies.
Examples of User Behavior Analytics in Different Industries
- In e-commerce, UBA can help identify shopping patterns, preferences, and trends to personalize product recommendations and optimize pricing strategies.
- In healthcare, UBA can be used to monitor patient behavior, detect anomalies in treatment adherence, and improve overall care delivery.
- In cybersecurity, UBA can analyze user activities to detect suspicious behavior, prevent data breaches, and strengthen network security.
Importance of Analyzing User Behavior for Businesses
Understanding user behavior is crucial for businesses to make informed decisions and drive growth. By analyzing how users interact with their products or services, companies can tailor their offerings to meet customer needs, improve customer satisfaction, and increase profitability. Additionally, UBA can help businesses identify areas for improvement, optimize processes, and stay ahead of competitors in today’s digital landscape.
Implementing User Behavior Analytics

When it comes to setting up user behavior analytics tools, there are a few key steps to follow to ensure effective implementation. First, you need to select the right analytics tool that aligns with your specific needs and goals. Next, you will need to integrate the tool with your website or application to start collecting data. Once the tool is set up, it’s important to define key metrics and goals that you want to track to measure user behavior accurately. Finally, regularly monitor and analyze the data to gain valuable insights and make informed decisions.
Comparing User Behavior Analytics Tools
- Google Analytics: A widely used tool that provides comprehensive data on user behavior, traffic sources, and conversions.
- Hotjar: Offers heatmaps, session recordings, and user feedback tools to understand user interactions on your site.
- Kissmetrics: Focuses on tracking individual user behavior and providing insights to optimize user engagement and conversions.
Best Practices for User Behavior Analytics
- Set clear objectives: Define specific goals and metrics you want to track to ensure you are collecting relevant data.
- Segment your audience: Analyze user behavior based on different segments to understand varying user needs and preferences.
- Combine quantitative and qualitative data: Utilize both numerical data and user feedback to get a holistic view of user behavior.
- Regularly test and iterate: Continuously test different hypotheses and strategies to improve user experience based on analytics insights.
Interpreting User Behavior Data: User Behavior Analytics
Understanding how to interpret data collected through user behavior analytics is crucial for optimizing strategies and improving user experience. By analyzing the data effectively, businesses can gain valuable insights into user preferences, trends, and areas for improvement.
Common Metrics for Analyzing User Behavior
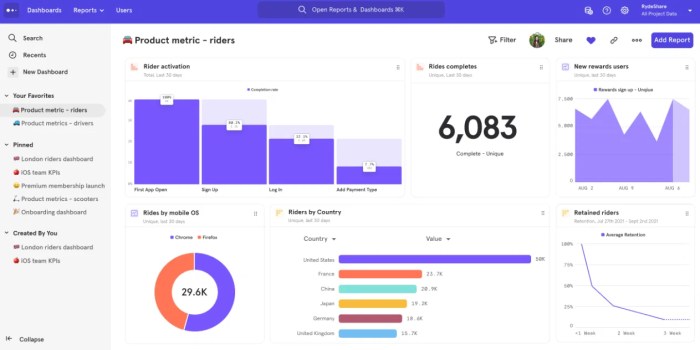
- Conversion Rate: This metric measures the percentage of users who take a desired action, such as making a purchase or signing up for a newsletter. A high conversion rate indicates that the website or app is effectively engaging users.
- Bounce Rate: The bounce rate shows the percentage of users who leave a website after viewing only one page. A high bounce rate may indicate that the landing page content is not relevant to users.
- Time on Page: This metric measures how long users spend on a particular page. A longer time on page may suggest that the content is engaging and valuable to users.
- Click-Through Rate (CTR): CTR measures the percentage of users who click on a specific link or call-to-action. A high CTR indicates that the link is compelling and attracts user attention.
Examples of Actionable Insights from User Behavior Data
- Identifying Popular Content: By analyzing user behavior data, businesses can determine which pages or posts receive the most engagement. This information can help in creating more of the content that resonates with users.
- Improving User Experience: Data on user interactions, such as heatmaps and session recordings, can provide insights into areas where users may be facing challenges or frustrations. Businesses can then make necessary improvements to enhance the overall user experience.
- Personalizing Recommendations: User behavior data can be used to personalize product recommendations or content suggestions based on a user’s preferences and past interactions. This can lead to increased engagement and conversions.
Enhancing User Experience with Analytics

When it comes to enhancing user experience with analytics, leveraging user behavior data is crucial in making informed decisions to improve website or app design. By understanding how users interact with your platform, you can implement strategies to optimize their experience and ultimately increase customer satisfaction and retention.
Utilizing Heatmaps for Design Optimization
One effective strategy for optimizing user experience based on analytics data is utilizing heatmaps. Heatmaps visually represent user interactions by highlighting areas of high and low activity on a webpage or app. By analyzing these heatmaps, you can identify which elements attract the most attention and which ones are being overlooked. This insight allows you to redesign your layout to prioritize important features and enhance user engagement.
A/B Testing for User Engagement, User Behavior Analytics
Another valuable strategy is conducting A/B testing to compare different versions of a webpage or app and determine which one performs better in terms of user engagement. By analyzing metrics such as click-through rates, bounce rates, and conversion rates, you can identify the design elements that resonate most with users. This data-driven approach enables you to make informed decisions on how to refine your design to better meet user expectations and preferences.
Personalization and Customization for Improved Satisfaction
Implementing personalization and customization features based on user behavior analytics can greatly impact customer retention and satisfaction. By tailoring the user experience to individual preferences, such as recommending products based on past purchases or showing personalized content based on browsing history, you can create a more personalized and engaging experience for users. This level of customization not only enhances user satisfaction but also builds loyalty and encourages repeat visits.